TestCafe v2015.1
TEST DEBUGGING
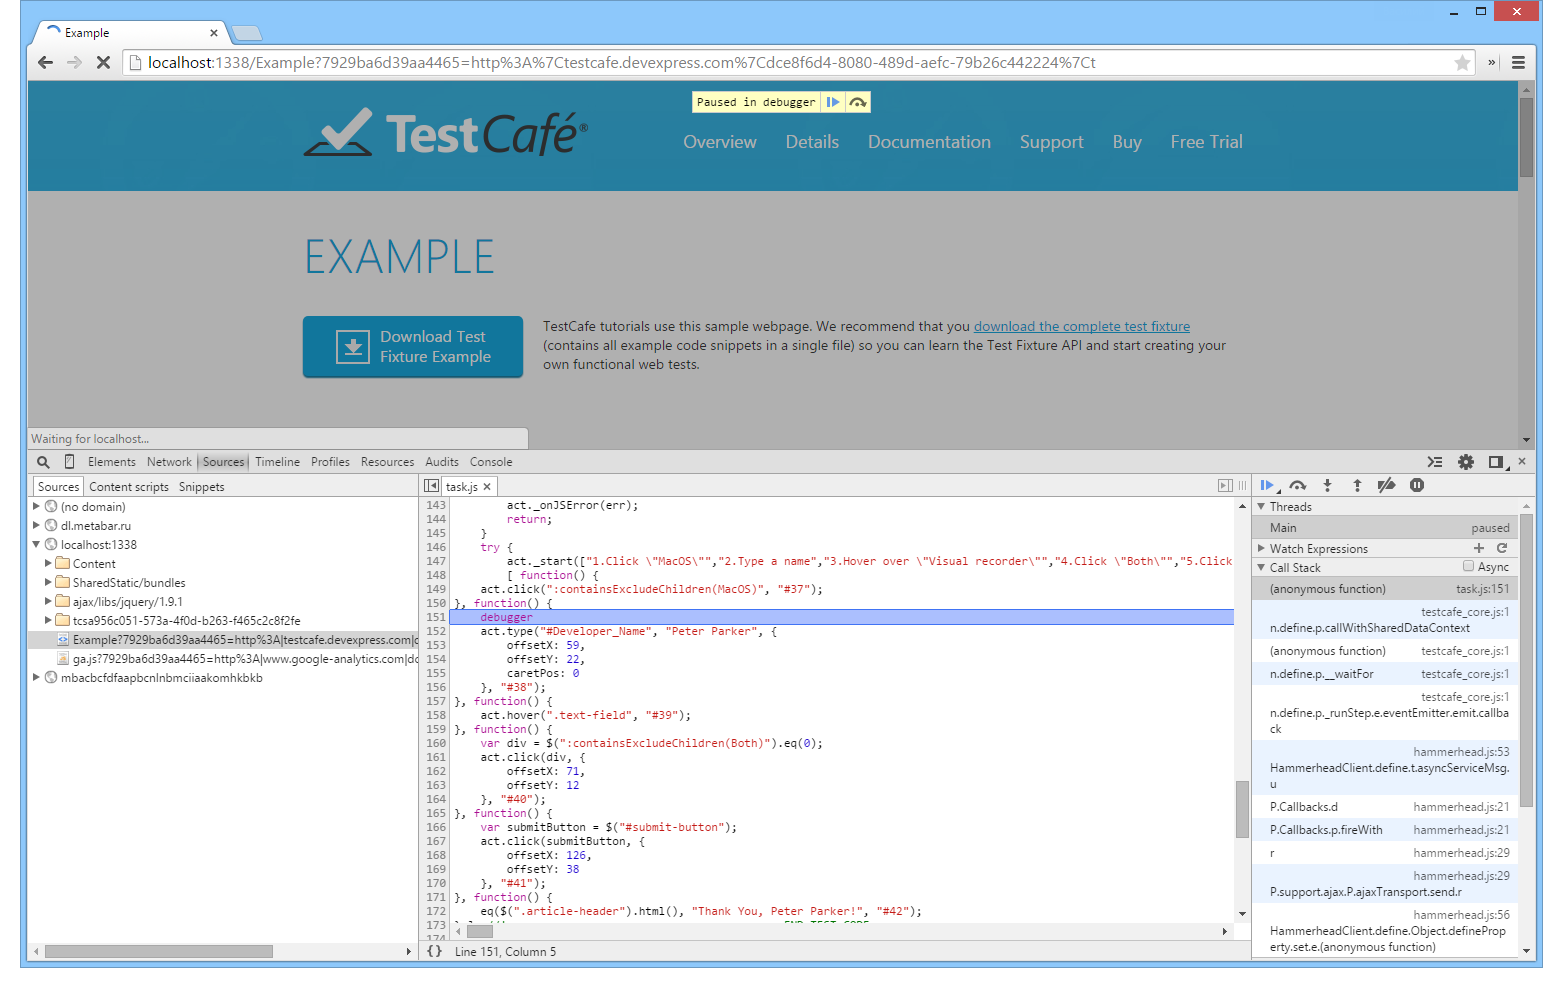
The majority of modern browsers ship with integrated Web Developer tools, including JavaScript debuggers. And since TestCafe tests run JavaScript code, you can use your browser's built-in debugger to analyze your test code. To set up a breakpoint in your code, use the debugger keyword.
debugger;
Most browsers allow for breaking script execution only when developer tools are invoked. Therefore, we suggest the following workflow when you are debugging tests.
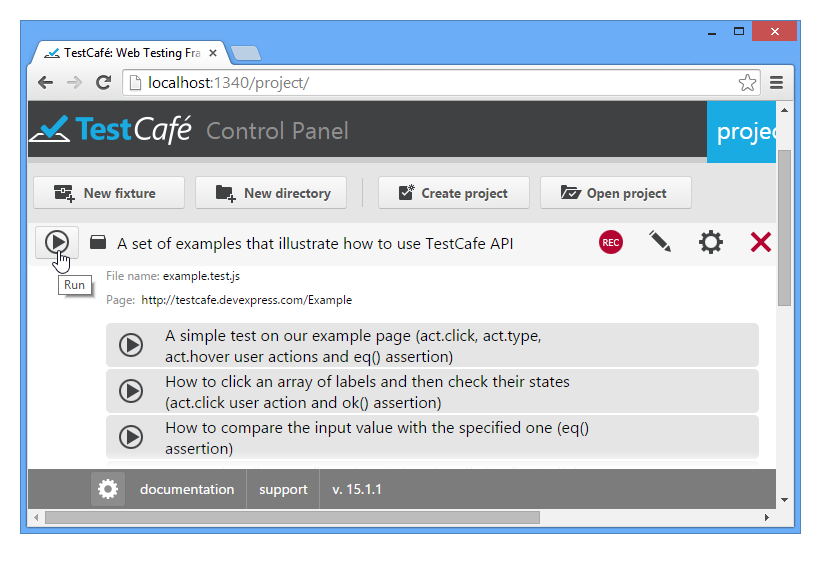
- Launch the target browser and click the Run button for the desired test, fixture or folder.
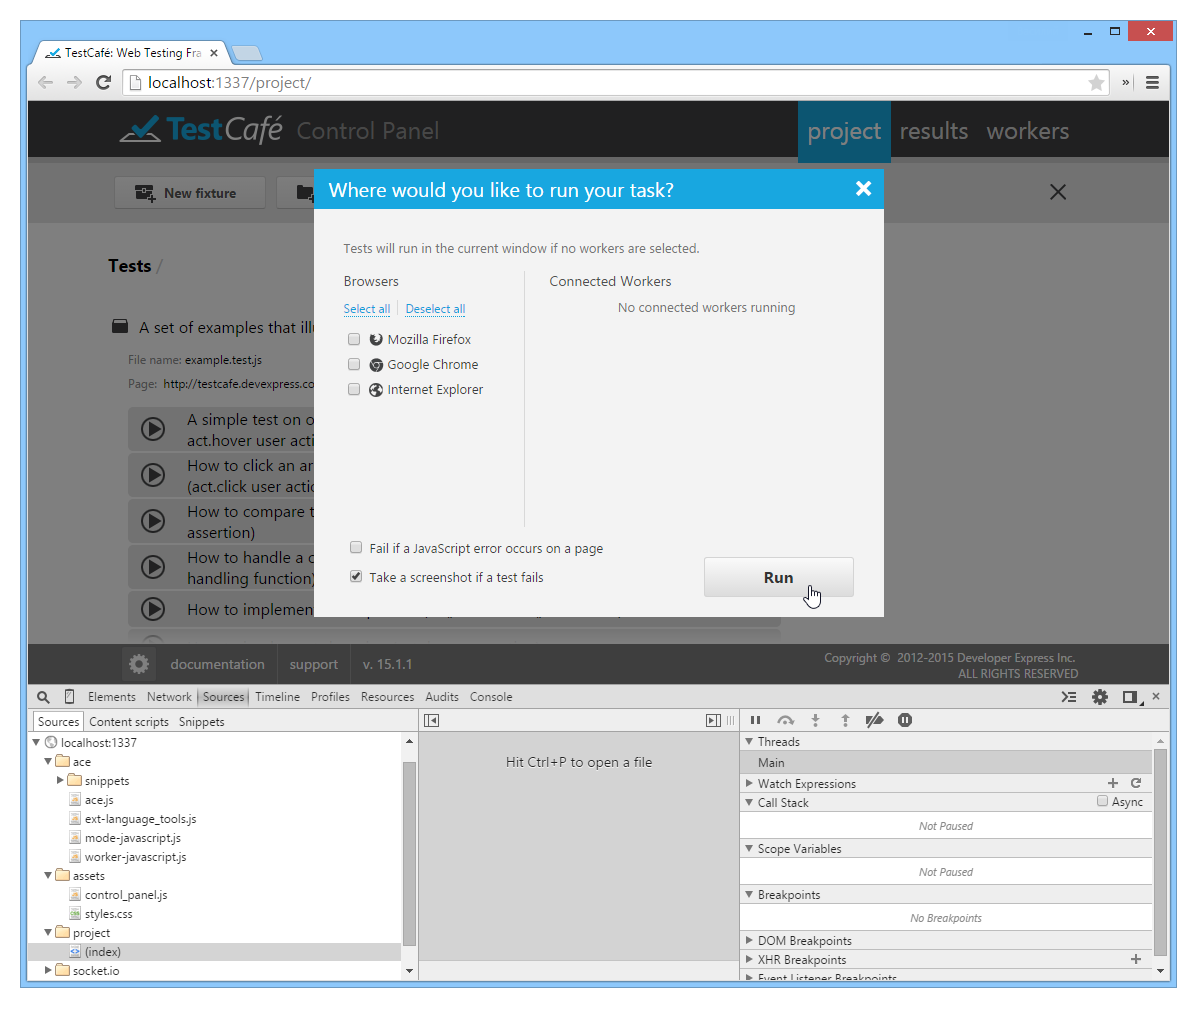
- This invokes the Run Test dialog. Make sure that no check box in the Browsers and Connected Workers sections is selected so that the test will run in the current window.
Invoke Web Developer Tools and click Run.
The test will start and when the breakpoint is reached, test execution will be suspended.