CONTROL PANEL
TestCafe Settings
You can access TestCafe settings from the Control Panel via the  button in the bottom left corner of the window.
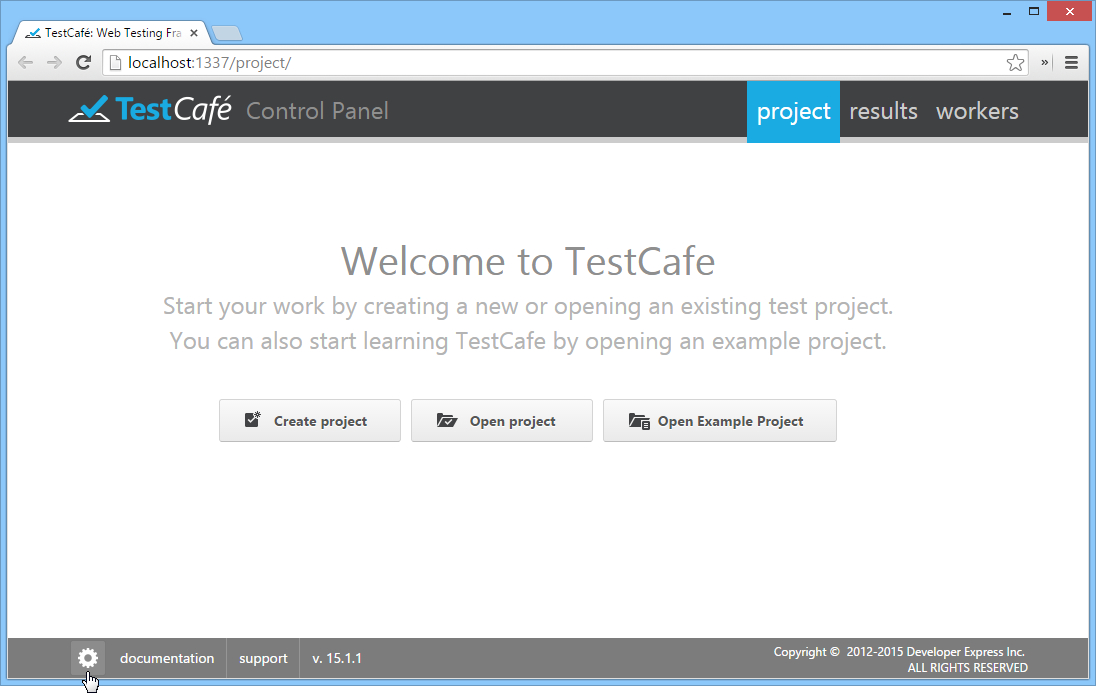
This button opens a settings view that contains the following sections: Browsers, Network and Reports.
Use the Browsers section to edit the list of browsers used by TestCafe.
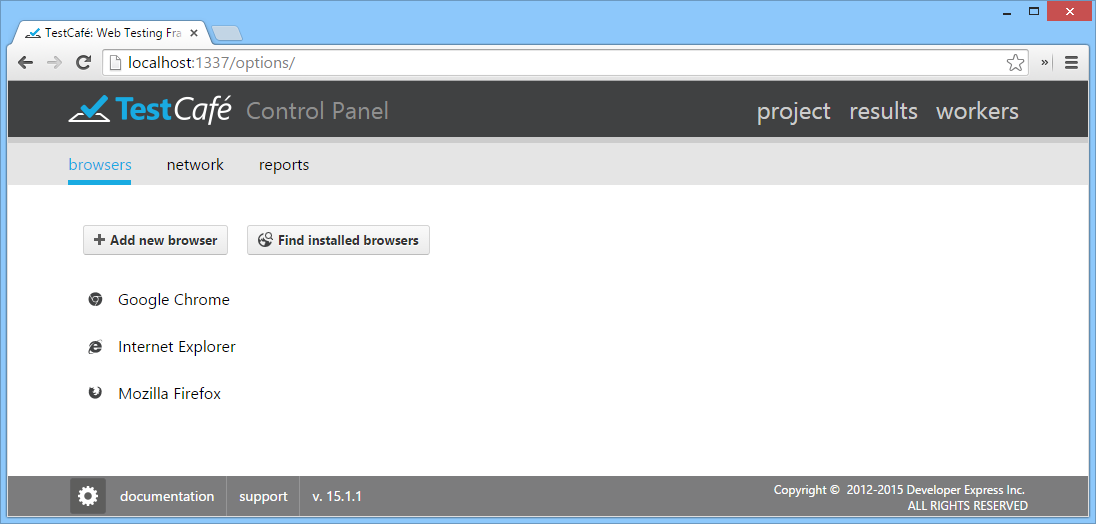
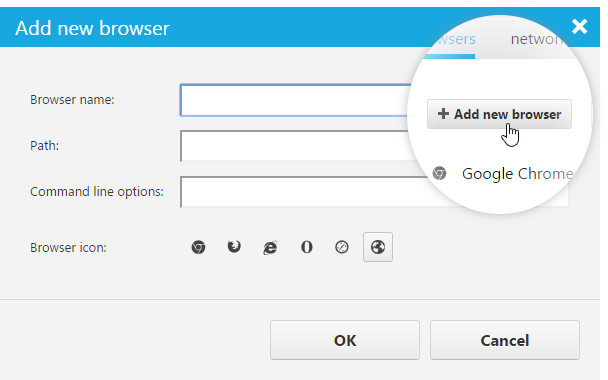
To add a new browser, click the Add new browser button. This button invokes a dialog in which you can select the browser's executable file, specify its name, as well as optionally add command line parameters and choose an icon.
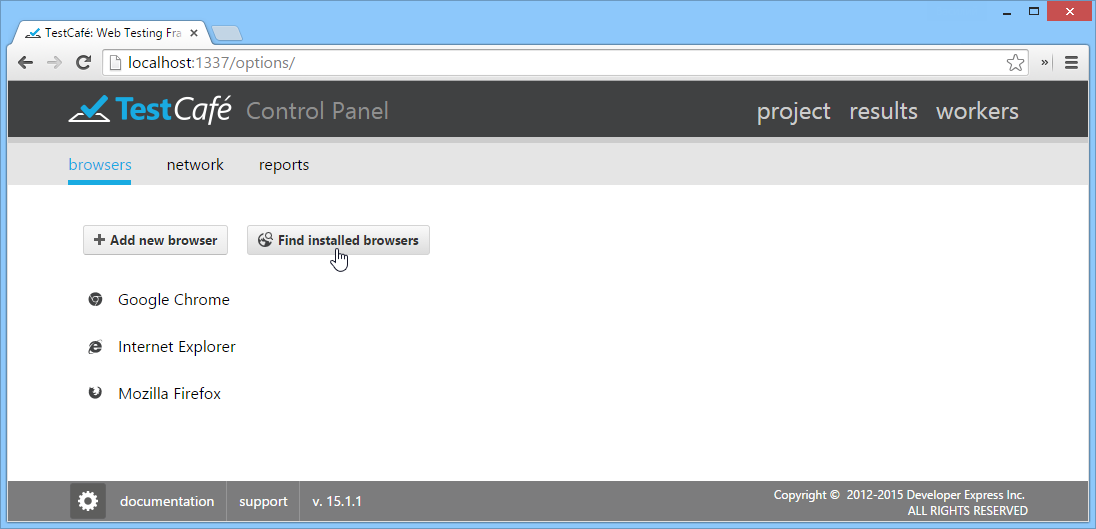
Use the Find installed browsers button to automatically populate the list with all browsers available on your system.
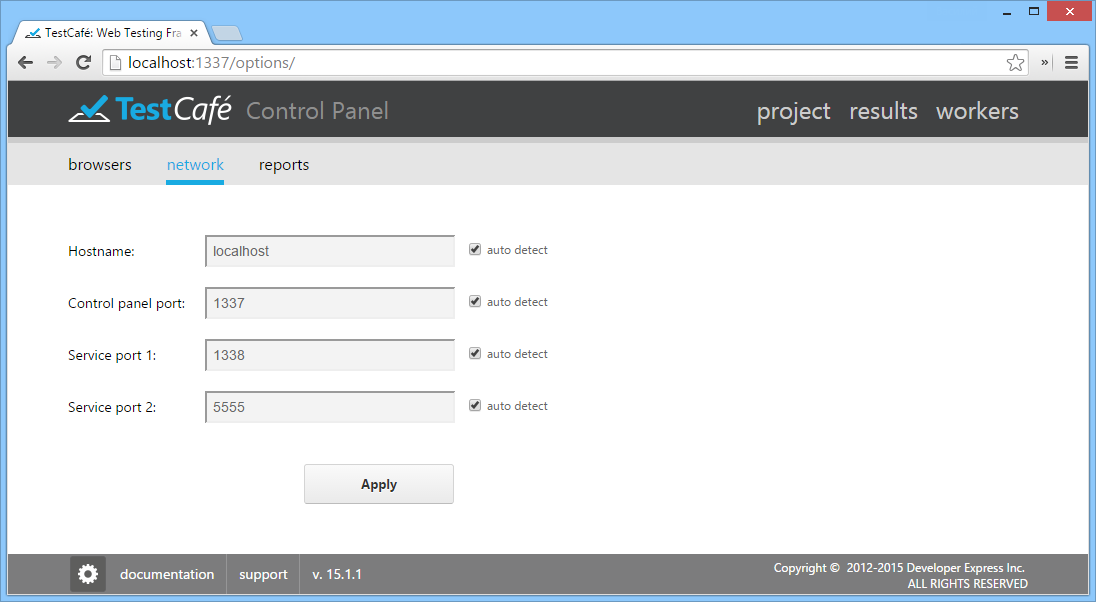
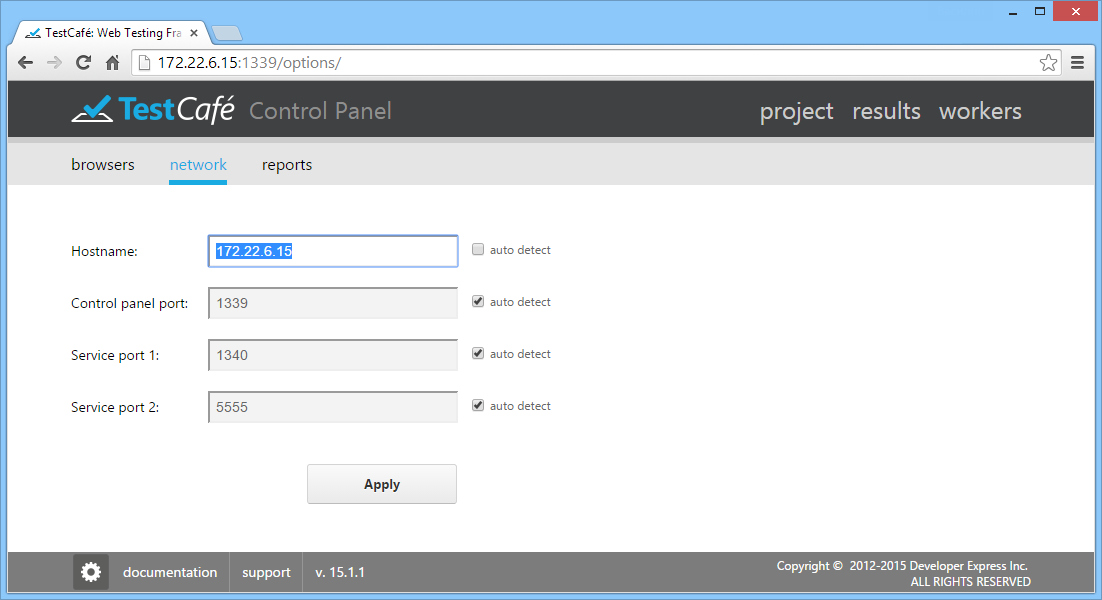
Use the Network section to modify network settings (hostname, Control Panel Port, Service Port 1 and Service Port 2). If an auto detect box is checked, TestCafe automatically determines the respective network setting at every launch. To edit a setting, uncheck its auto detect box.
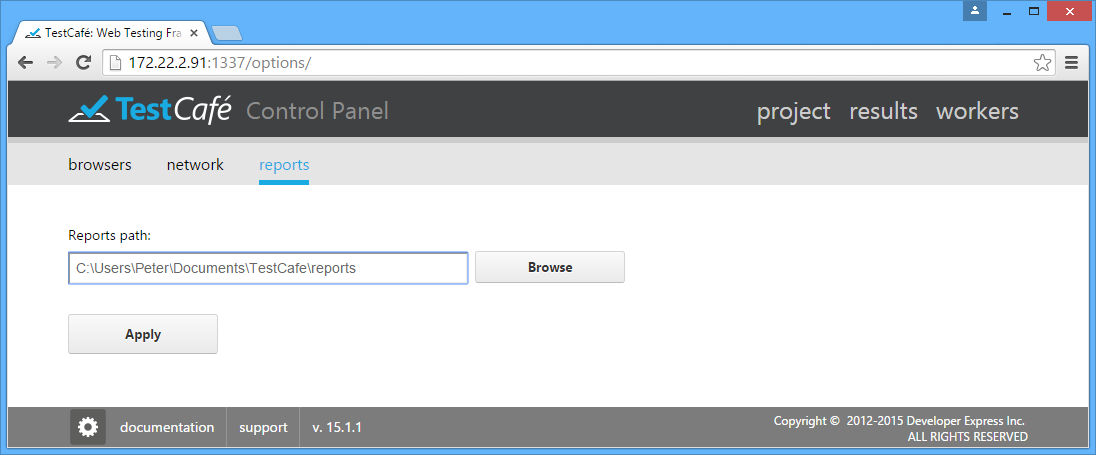
Use the Reports section to specify the directory where test run reports are stored.
TestCafe stores its settings within a specific configuration file - config.json. If the configuration file is missing, TestCafe will use settings saved during the first run.
Important note
Starting with version 14.1.4, to preserve configuration settings and test file content among TestCafe updates, the default location of the TestCafe configuration file (config.json) and the default location of a directory containing test and fixture files (such as example.test.js) are changed to the following paths. New locations for Windows: \Users\[username]\Documents\TestCafe\config.json \Users\[username]\Documents\TestCafe\Tests New locations for Mac OS: /Library/Application Support/TestCafe/[username]/config.json /Library/Application Support/TestCafe/[username]/my_tests Note that if you have already been using the previous installation of TestCafe, you can use a copy of the existing config.json.
Projects Tab
Projects
TestCafe's project is a folder that contains a set of individual or organized fixtures and tests located on a specific path, which you can later modify manually by using any JavaScript editor.
Once TestCafe is running, it allows you to create a new project, or open an existing one or example project. To create a new project, click Create project to invoke a dialog window in which you can specify the project's name and path.
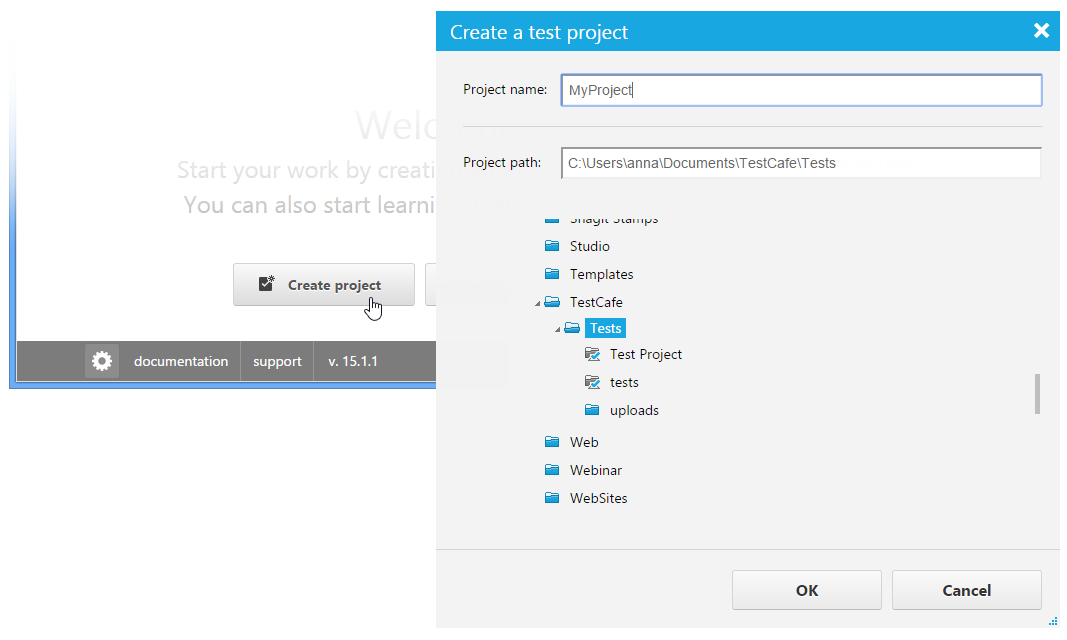
The newly created project will be opened within the Control Panel without any fixtures and tests. All fixtures and tests you create within that project will be stored at the path specified during project creation. For more information, see Creating a Fixture and Test Recording.
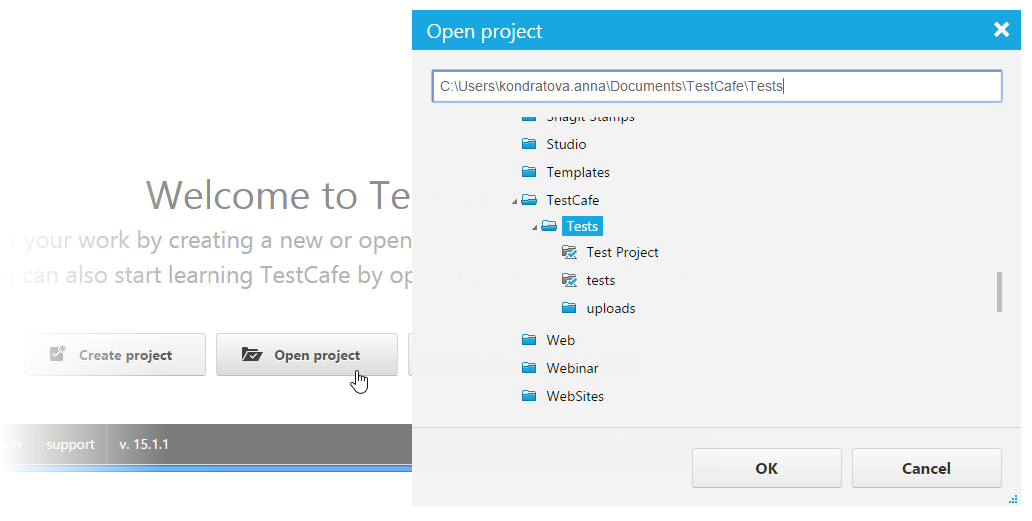
To open an existing project, click the Open Project button. TestCafe opens a dialog where you specify the project's path and click the OK button. All project fixtures and tests will be opened within the Control Panel.
To try sample tests that illustrate TestCafe's API functionality, click the Open Example Project button.
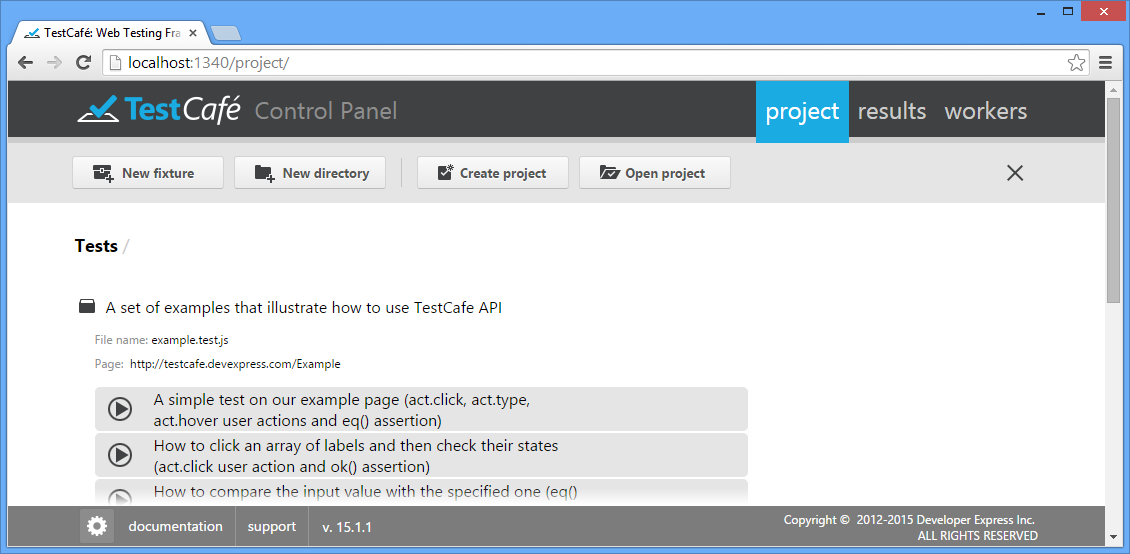
To close the project, use the  button.
Fixtures
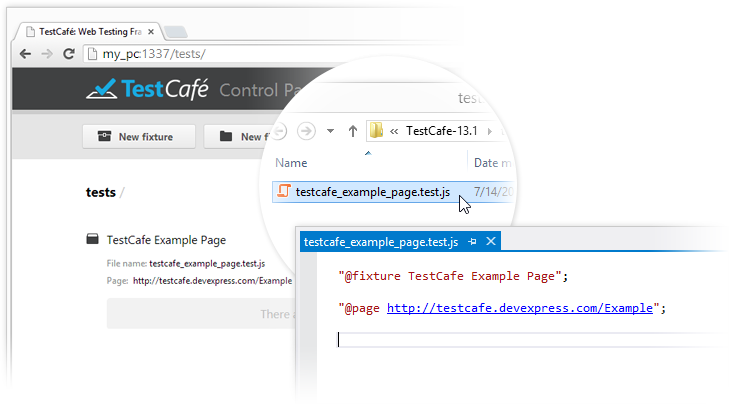
Test fixtures are JavaScript files with *.test.js extension that contain one or more tests for a single specified target URL. Therefore, you will usually have one test fixture per website page/route.
Creating a Fixture
To create a new fixture, click New Fixture to invoke a dialog window in which you can specify the fixture name and target web page. If the website you are going to test requires Windows or Basic HTTP Authentication, specify the user credentials within the specific Network Authentication area of the New Fixture Dialog. TestCafe will save them to the fixture file within the auth directive (read the Http Authentication topic to learn how to handle Http Authentication within the Control Panel).
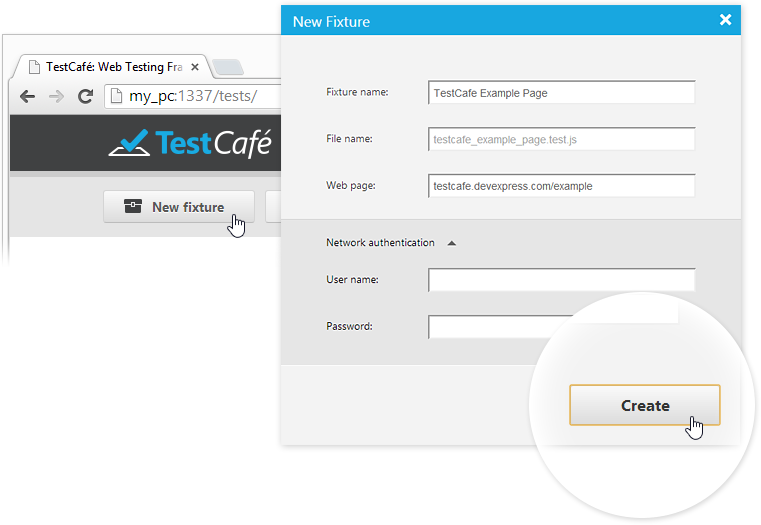
This newly created fixture represents a JavaScript file that stores the settings you have just entered, which is located in the folder that has been specified during the creation of the project (use the Projects section).
To organize fixtures in the project, you can create one or several directories by using the New Directory button and locate fixtures within them.
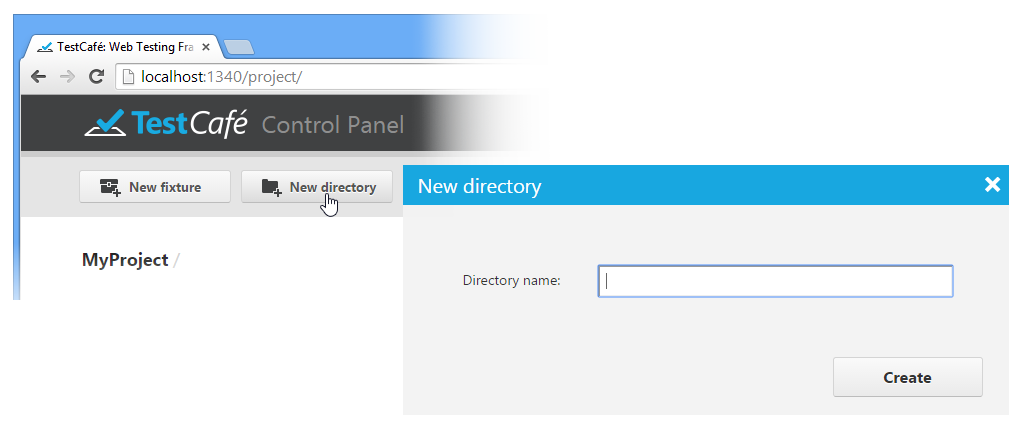
While the TestCafe UI allows you to browse any test hierarchy you created, it doesn't permit you to reorganize your tests. If you need to change the directory structure and move fixtures from one folder to another, use your file explorer of choice. All changes will immediately be reflected in the TestCafe UI.
Test Recording
You can create a test either by recording it by using the visual test recorder or manually by using TestCafe's API and integrated test code editor.
To start the visual test recorder, hover over the fixture in which you wish to create a test, and press Record Test Actions.
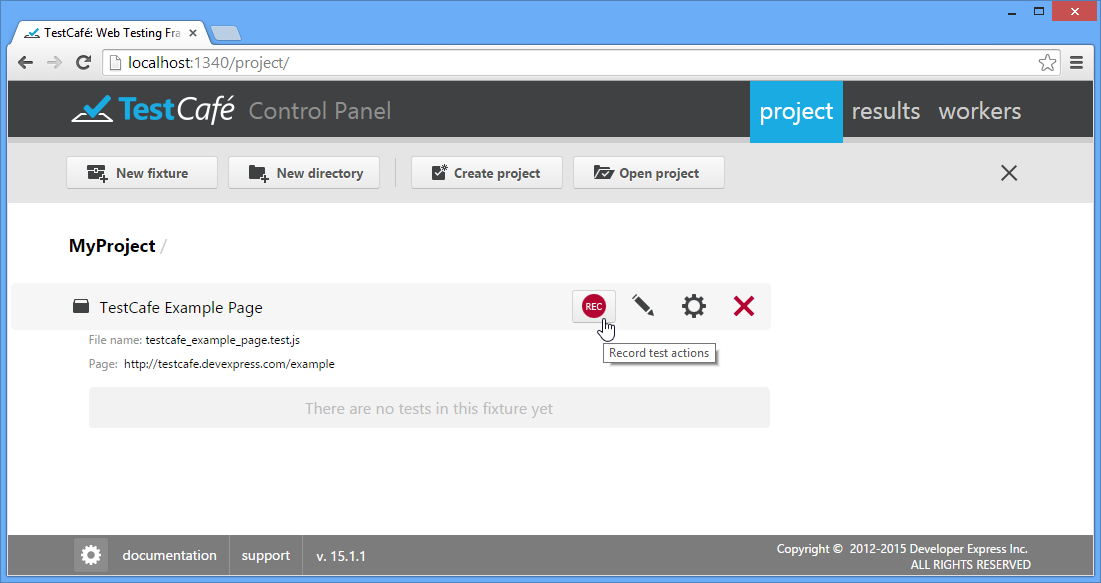
To learn how to use the test recorder, see Visual Test Recorder.
Test Code Editing
After you have completed the recording, your test will be saved to the fixture. You can review and edit its code by using the built-in code editor that is opened by the ![]() button.
button.
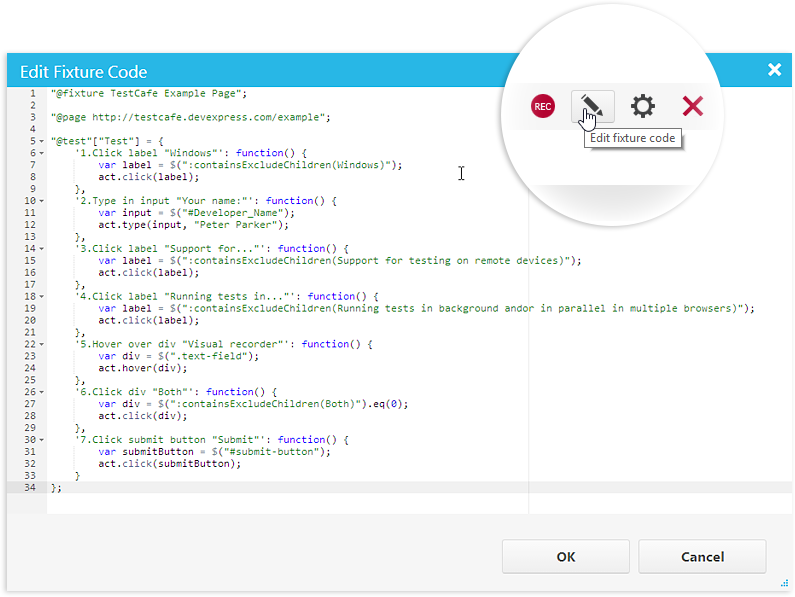
To learn more about creating and editing tests in code, see Test Fixture API Reference.
Modifying Fixtures
You can change the fixture name, rename a corresponding JS file, specify target webpage URL and authentication credentials by using the Modify Fixture dialog. To invoke this dialog, click the ![]() button.
button.
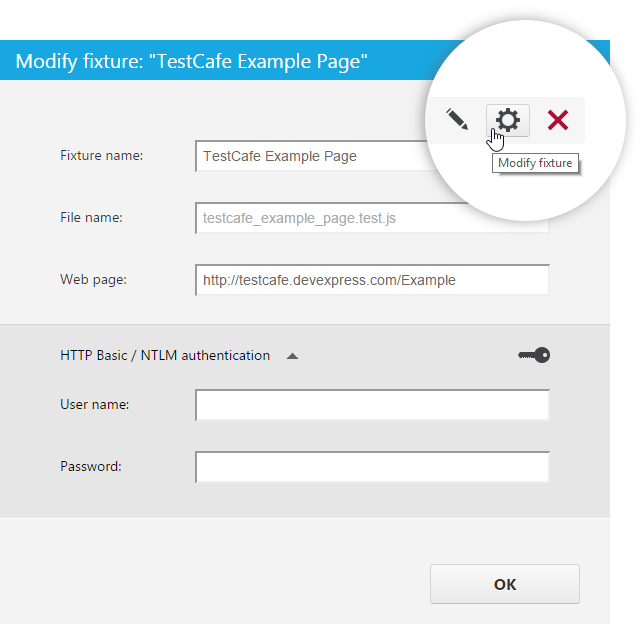
If you do not specify the file name explicitly, it will be automatically generated from the fixture name (and displayed in gray). In case the fixture name contains characters prohibited in file names, they will be replaced or removed from the file name.
Running Tests
You can run an individual test or all tests in a fixture from the Projects tab. To do so, click the Run button next to the required fixture or test. Note that for fixtures, this button only appears when you hover over the row with the mouse pointer.
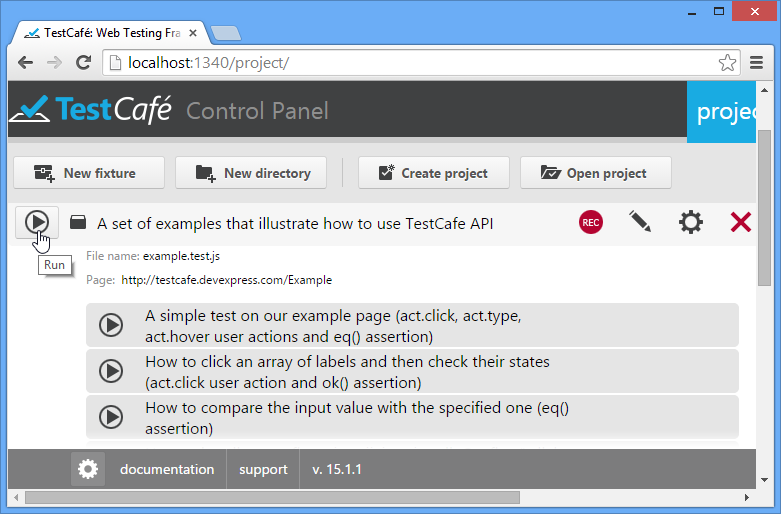
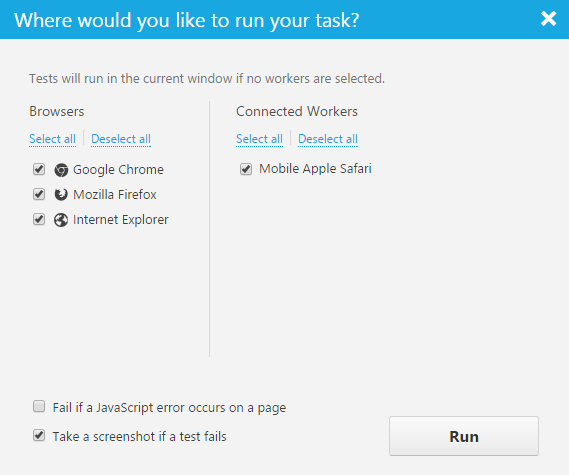
This will invoke a dialog that lists all available target browsers and test-running options.
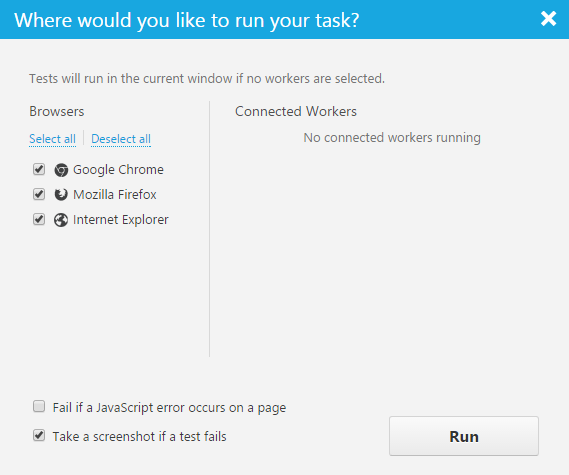
The Browsers section on the left hand side will list all browsers specified within the TestCafe Control Panel, as described in the TestCafe Settings topic.
The Connected workers section will list browsers on remote computers or mobile devices registered as described in the Workers Tab.
The Fail if a JavaScript error occurs on a page option specifies whether or not a test will fail if a JavaScript error occurs on a tested web page. By default, the option is enabled. Thus, in case of such errors, TestCafe stops the test execution and posts an error message to a report. If you want TestCafe to ignore JavaScript errors, disable the option.
The Take a screenshot if a test fails option specifies whether TestCafe will automatically take a screenshot of a tested page if an assertion fails or an error occurs. You can later view the screenshots in a test report on the Results tab.
Important note
- The automated screenshot feature is not available on the Linux operating system.
- Screenshots cannot be taken when a test is running in a remote worker.
If you click Run without selecting any browser, TestCafe will run tests within the same browser window. If you check any of the listed browsers, TestCafe will automatically run them, execute tests in them, collect the results and close browser windows after completion. Note that tests will be executed in parallel if more than one target browser is selected.
TestCafe emulates cursor movements during tests so that you can view the progress.
Important note
TestCafe always executes tests in an active browser tab. Make sure to keep the active tab open. Do not minimize browser windows. Inactive tabs and minimized browser windows switch to a lower resource consumption mode where tests are not guaranteed to execute correctly.
Parameterized Tests
Parameterized testing is a way of testing when data sets (input values and expected outputs) are stored separately from the test code. Data sets represent an array of parameters and their values. Each time the test is executed it uses data from each row sequentially. So, a number of test runs corresponds to the array size.
In the Control Panel, data-driven tests represent a group of tests marked by the  button.
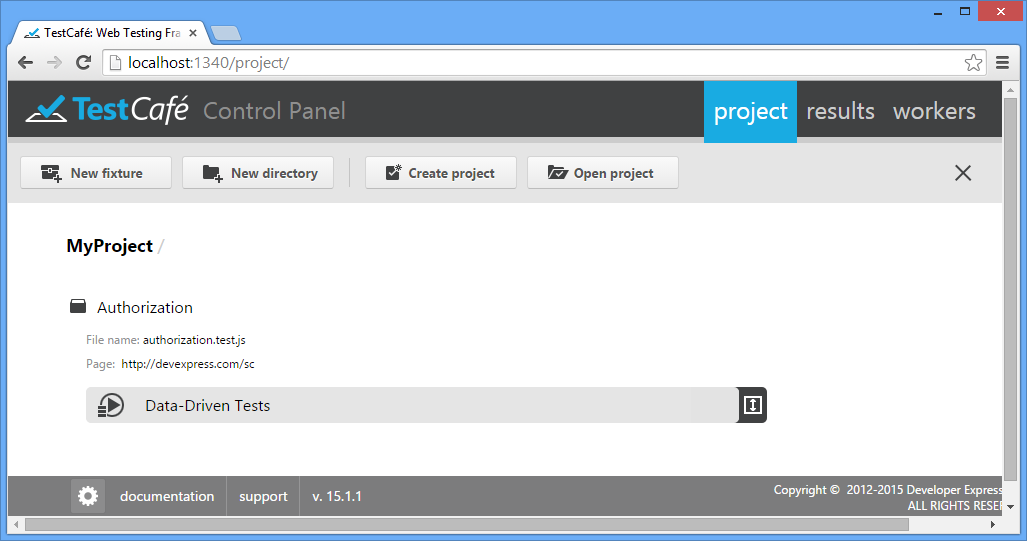
You can use the  and
and  buttons to open and close the group correspondingly.
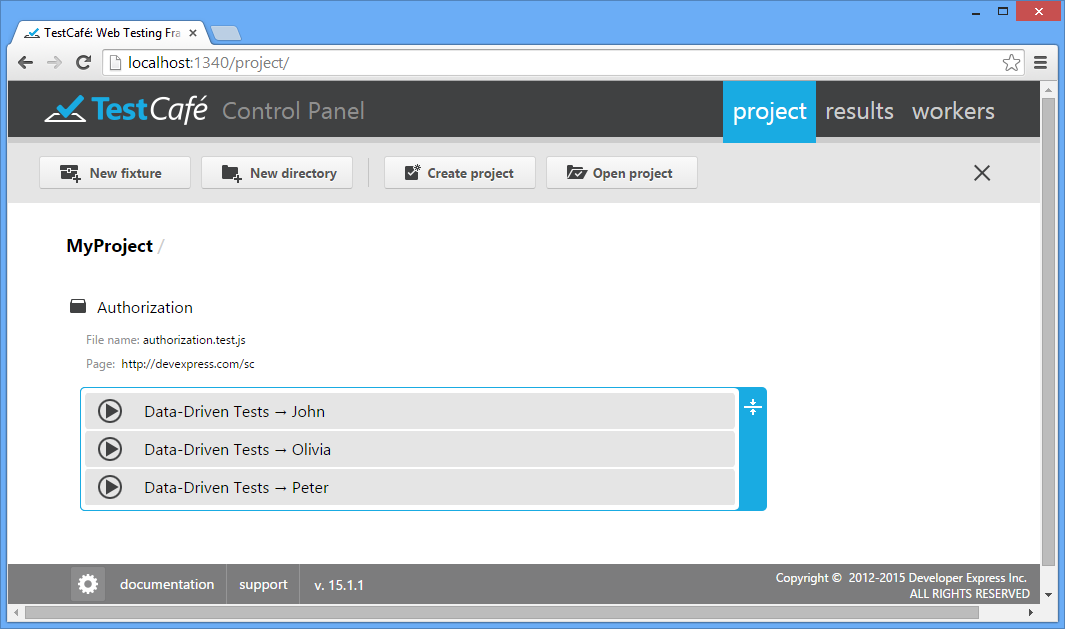
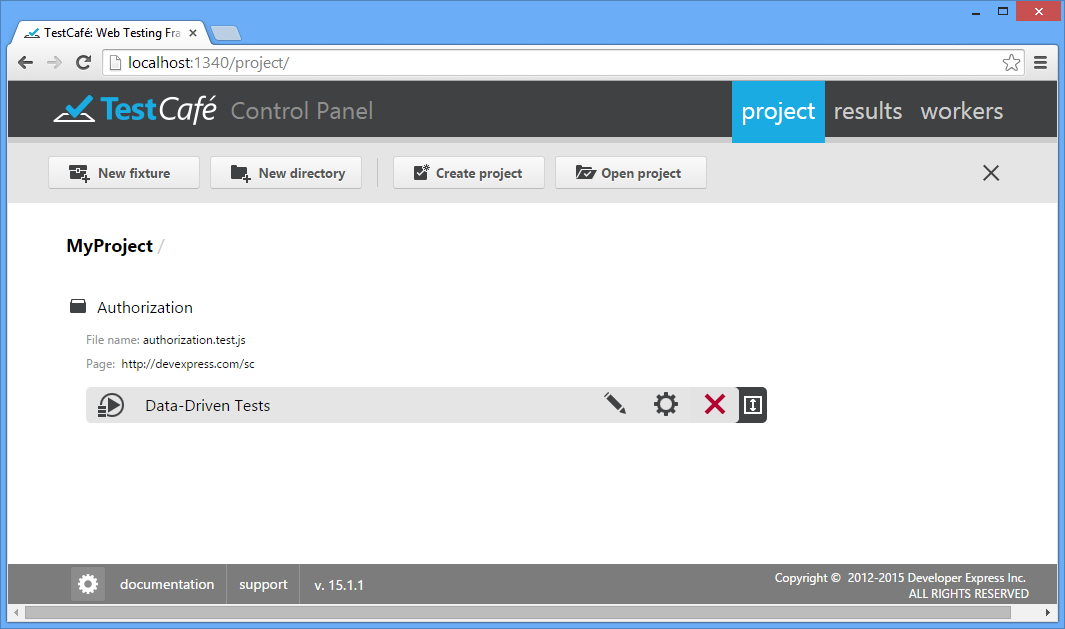
Data-driven tests can be run either as the whole group (via the button) or each test individually.
You can also edit the test code, modify its settings or delete the whole group of tests (deleting data-driven tests individually from the group is not permitted).
Results Tab
Use the Results tab to review and analyze test results. When you switch to this tab, you will see the results of all executed tasks. Red and green colors will indicate failed tasks and successfully completed tasks, respectively. The tab will also show running and pending tasks marked in blue.
Note that a test is only considered processed after it has been executed in all specified browsers, so TestCafe will only update the UI after all selected workers have finished.
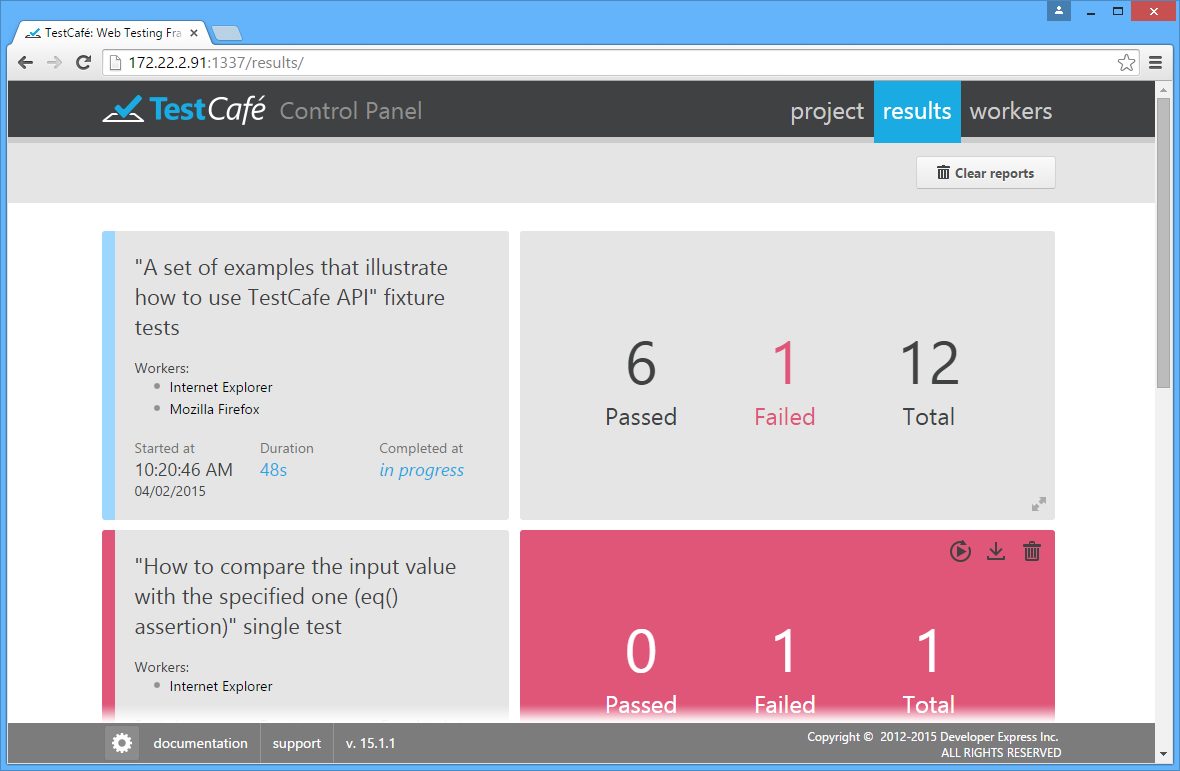
Every entry will display the start and end times of the task, all involved workers/browsers, and the number of tests that have failed and succeeded. You can also see detailed information about the task run (see below).
Detailed View
To see a detailed result report, click an entry in the Results tab. The tab will show the general information about the whole task run as well as detailed information about individual tests.
The detailed information is shown in the grid view. Each row in this grid corresponds to an individual test that was executed during the task run.
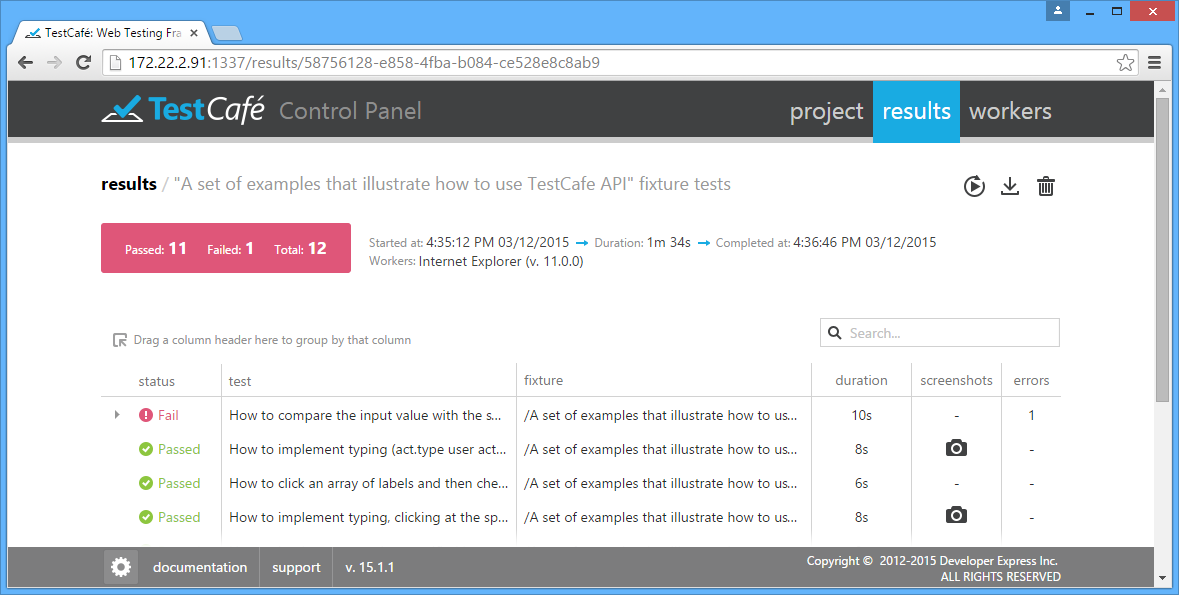
The grid has the following columns.
- status - The status of the test run: passed or failed.
- test - The name of the test.
- fixture - The name of the fixture that the test belong to.
- duration - The time spent on test execution.
- screenshots - If the test has the act.screenshot action, this column refers to a collection of screenshots captured during the test run. To view the captured images, click the
 icon.
icon. - errors - The number of errors occurred during the test run.
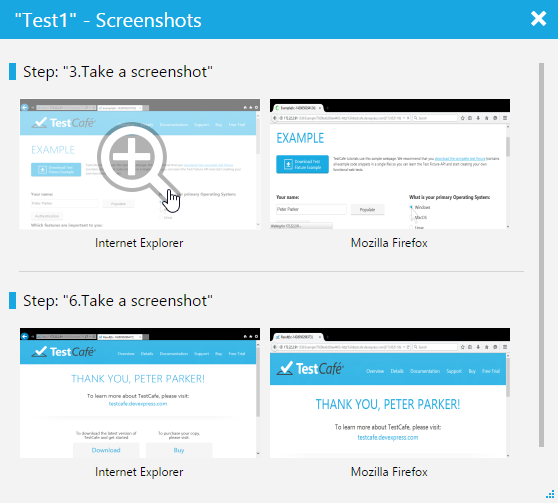
When you click the icon in the screenshot column, the screenshot collection is displayed in a new window. The images are grouped by test steps. Each group contains screenshots for all workers engaged in the test.
Analyzing Errors
The detailed view allows you to see additional information for failed tests. When you click a failed test, the grid view shows an extended message.
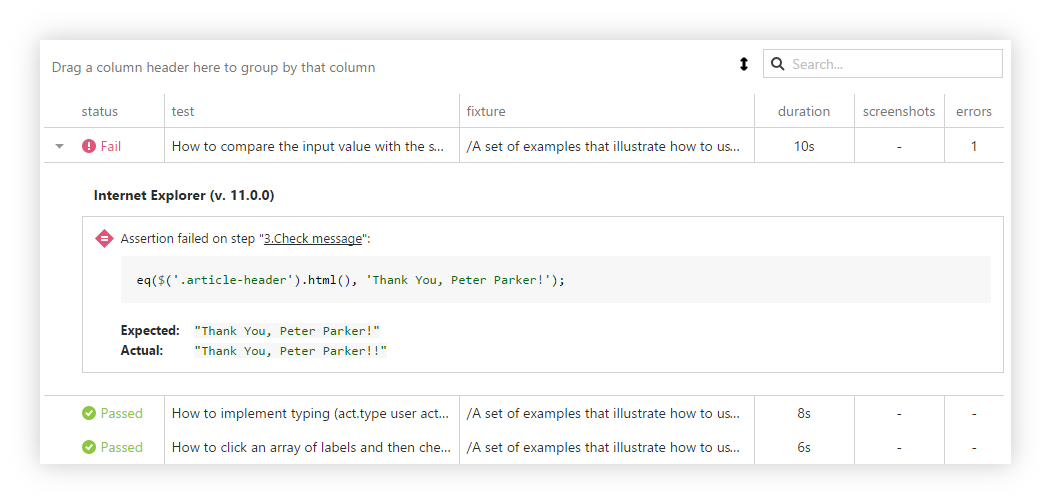
This message typically contains the cause of the fail and the step number where the fail occurs. You can easily switch to this step in the code editor by clicking the reference in the message.
If the Take a screenshot if a test fails option was enabled during the test run, you will also see a screenshot of the tested application below the extended message. This image helps you find causes of the error more quickly.
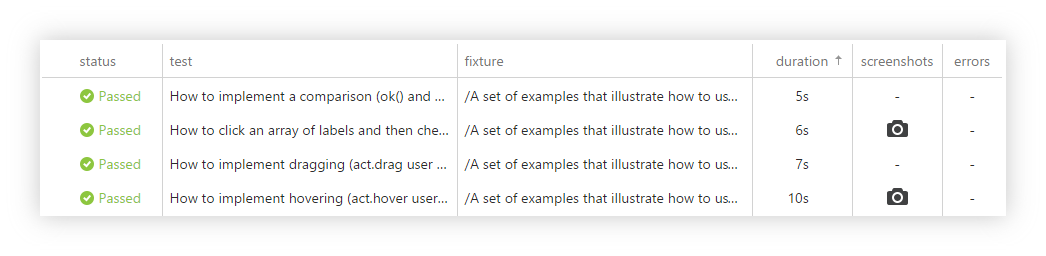
Sorting Results
By default, test results are sorted by the status column. You can sort the results by any column by clicking the column header. The sort icon  will appear next to the column caption. The image below demonstrates sorting test results by the duration column.
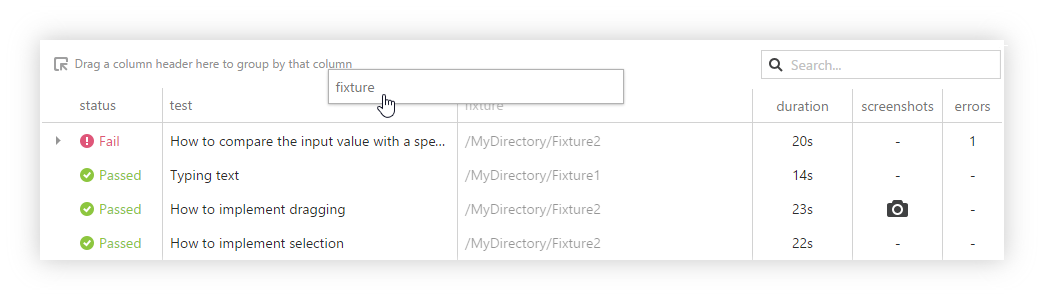
Grouping Results
You can group the test results by a specific column. To do this, drag the column header to Drag a column header here to group by that column.
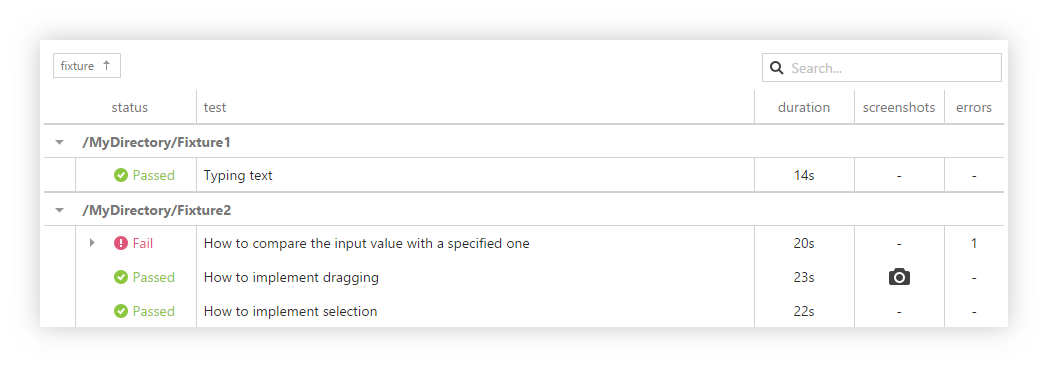
The records with identical column values will be arranged into groups. In the image below, the results are grouped against the Fixture column. To ungroup results, drag the column header back to the grid view.
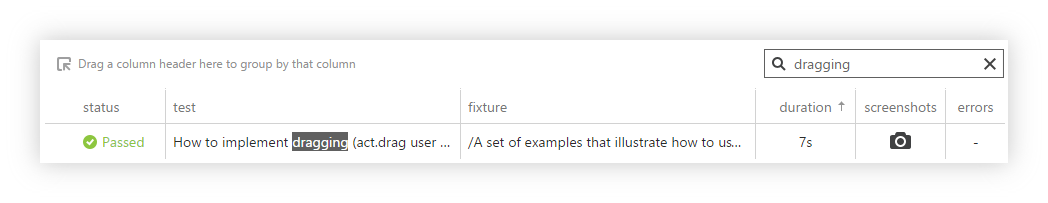
Searching Results
You can search through the results by using the search box with the ![]() icon. When you type a search text into this box, the grid’s content is filtered according to what you have typed.
For example, if you type “dragging”, the Result tab will show only the test results that contain that word. This makes finding report entries faster.
icon. When you type a search text into this box, the grid’s content is filtered according to what you have typed.
For example, if you type “dragging”, the Result tab will show only the test results that contain that word. This makes finding report entries faster.
Exporting Reports
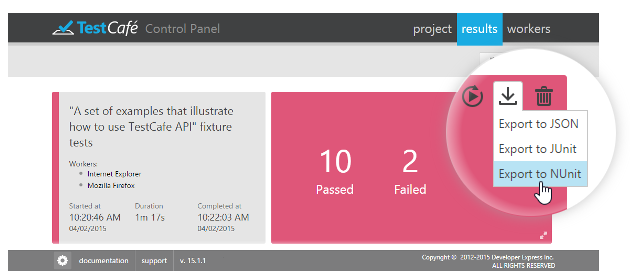
You can export test results to JSON, JUnit and NUnit formats. To do this, click the  button in the top right corner of the test report and select the desired format. The report file will be saved to your web browser's default download location.
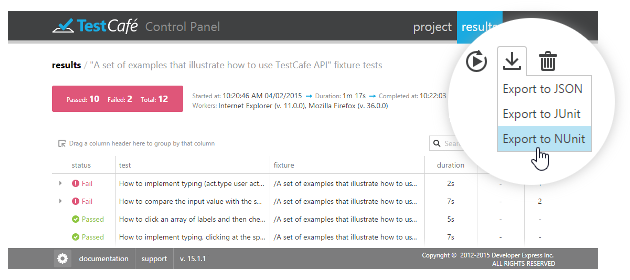
The button is also available in the detailed view of the Results tab.
Removing Reports
By default, TestCafe stores reports for all executed tasks and displays them in the Results tab. You can delete unnecessary reports when you need.
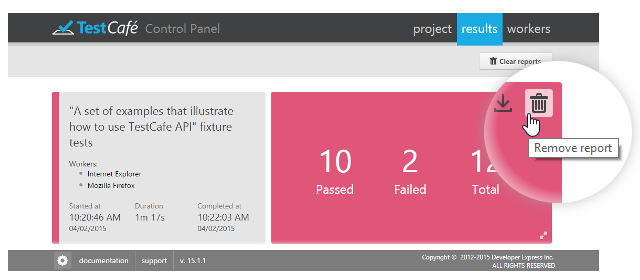
To delete a certain report, click the  button in the top right corner of the test report. TestCafe will ask for confirmation to delete a report. If you select Yes, TestCafe will remove the report from the Results tab and completely delete the report file from your computer.
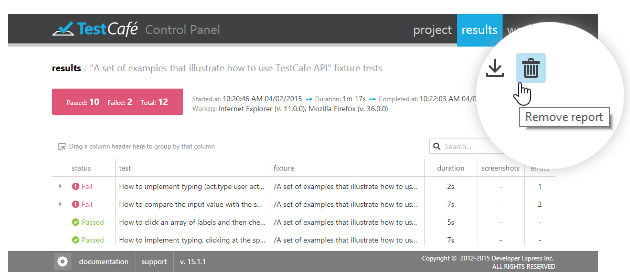
The button is also available in the detailed view of the Results tab.
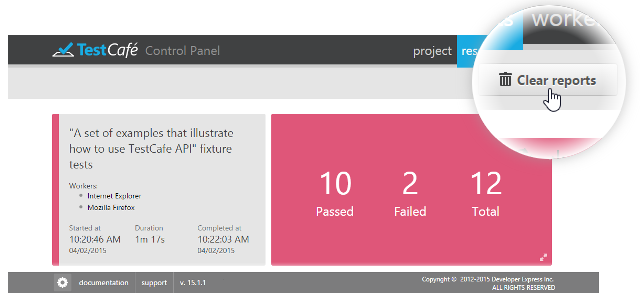
To remove all reports, click the Clear reports button in the top right corner of the Results tab. TestCafe will permanently delete all reports from the Results tab and your computer.
Restarting Tests
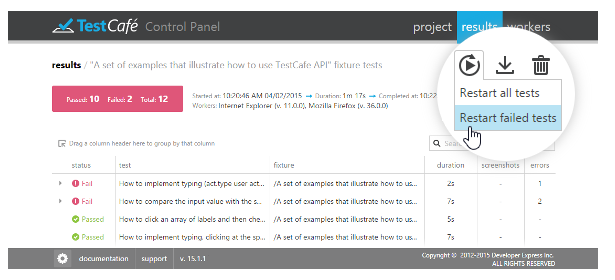
You can restart a test run right from the Results tab. To do this, click the  button and select Restart all tests or Restart failed tests.
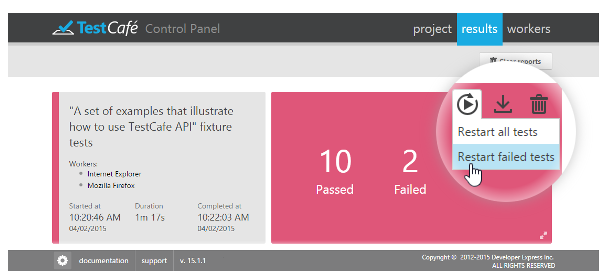
The button is also available in the detailed view of the Results tab.
Workers Tab
The Workers tab lists local and remote browser windows (workers) connected to the current TestCafe instance. For workers busy running tests, the execution progress is displayed.
When opened on a remote computer or mobile device, the Workers tab allows you to connect this device as a remote worker to run tests on it.
Connecting a Remote Device
Before you turn to your remote computer, tablet or smartphone, make sure that the machine that is running TestCafe has the hostname set to a value that allows remote access. You can check the currently specified value by looking at the TestCafe Control Panel URL. If it needs to be changed, refer to the TestCafe Settings topic.
Now open a browser on your remote device and navigate to the URL where the Workers tab is located.
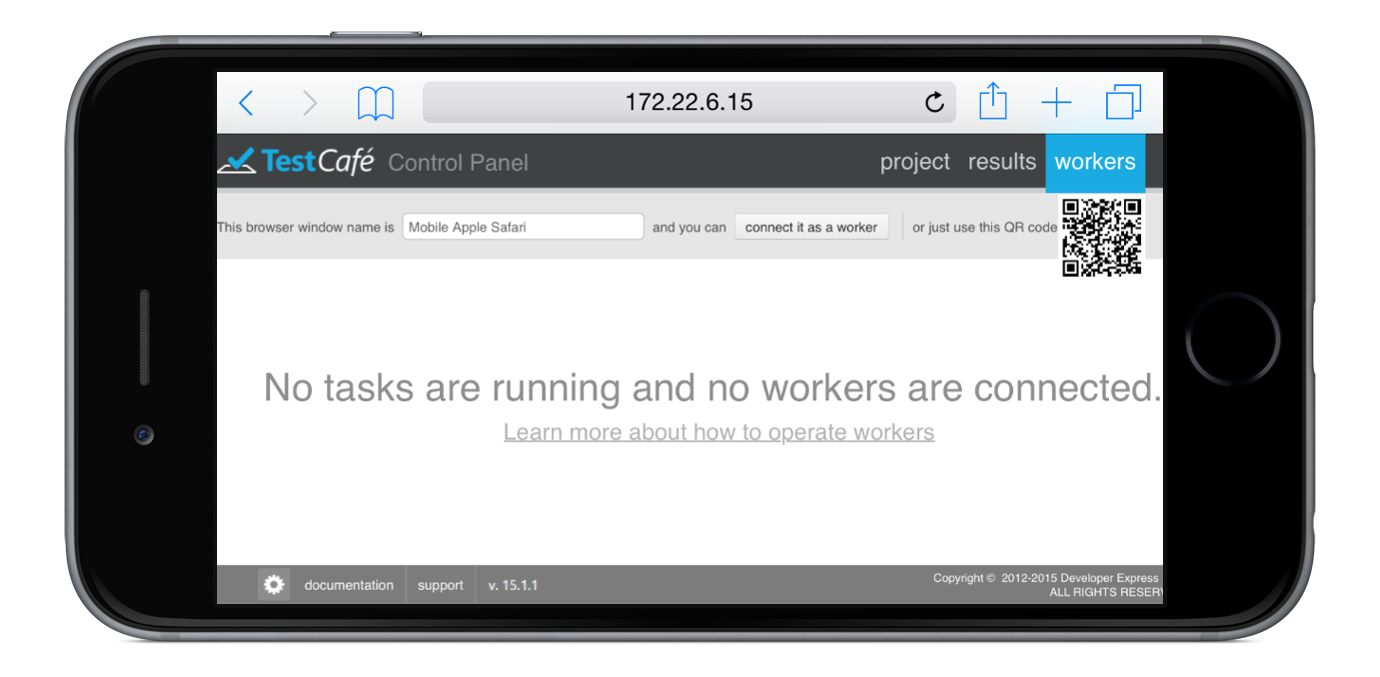
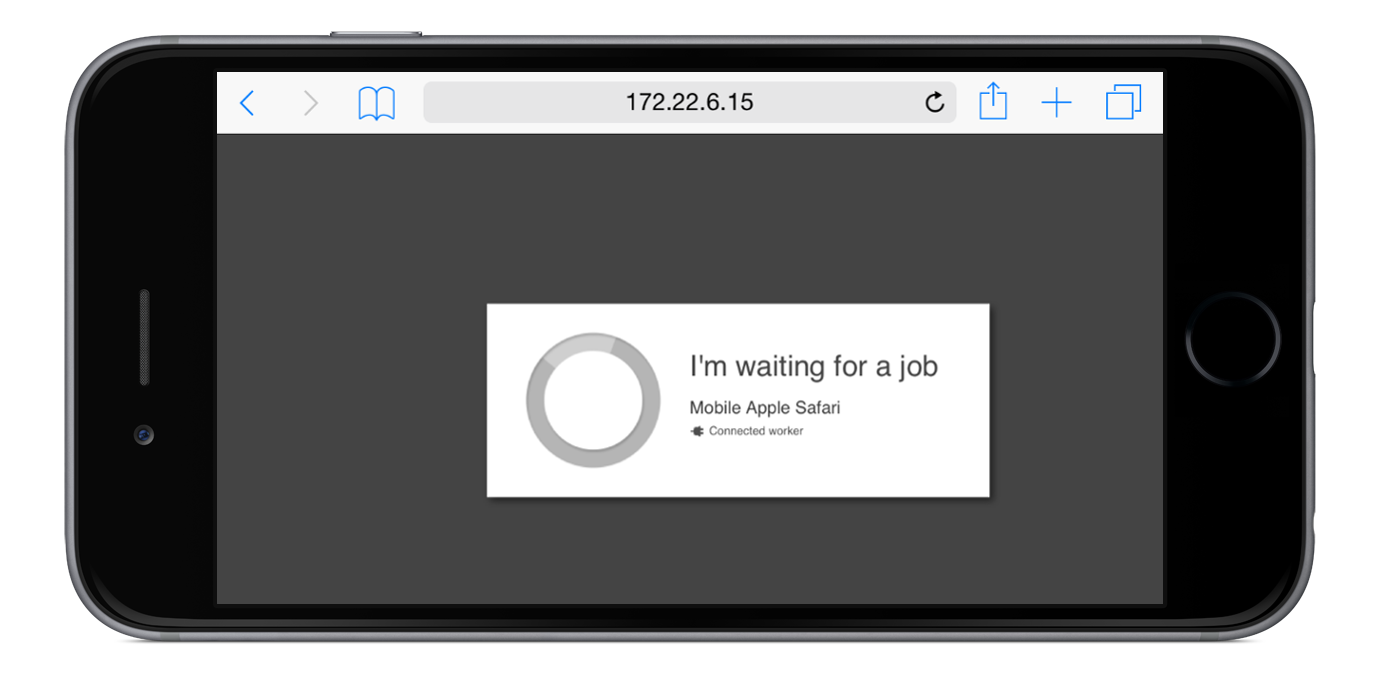
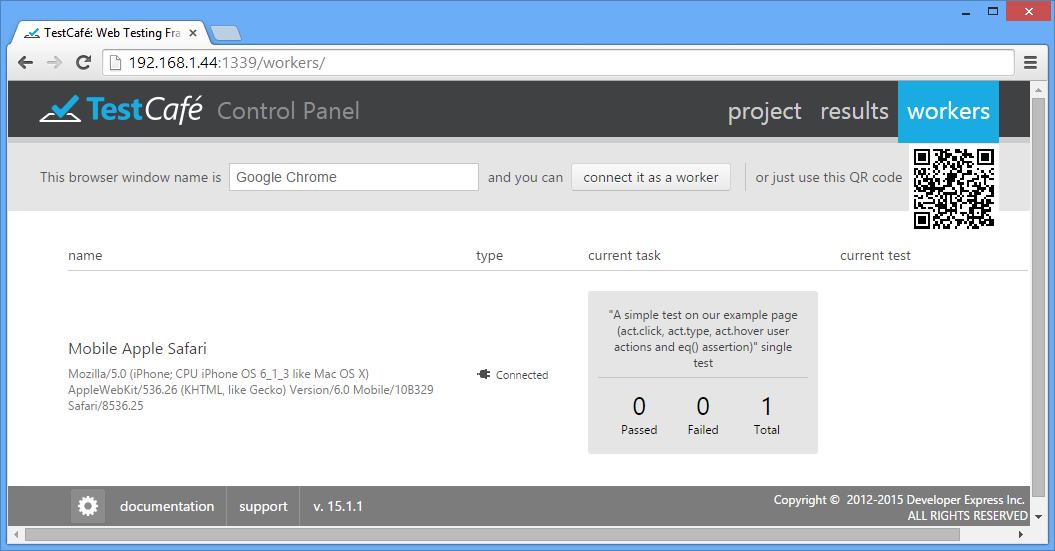
On this page, click connect it as a worker. The page will now indicate that this browser has been registered and is waiting for a task.
Important note!
You can specify a Worker name in the input field after the phrase "This browser window name is". This name can be obtained from the test code by using the this.__workerName property (refer to the Test Run Metadata topic).
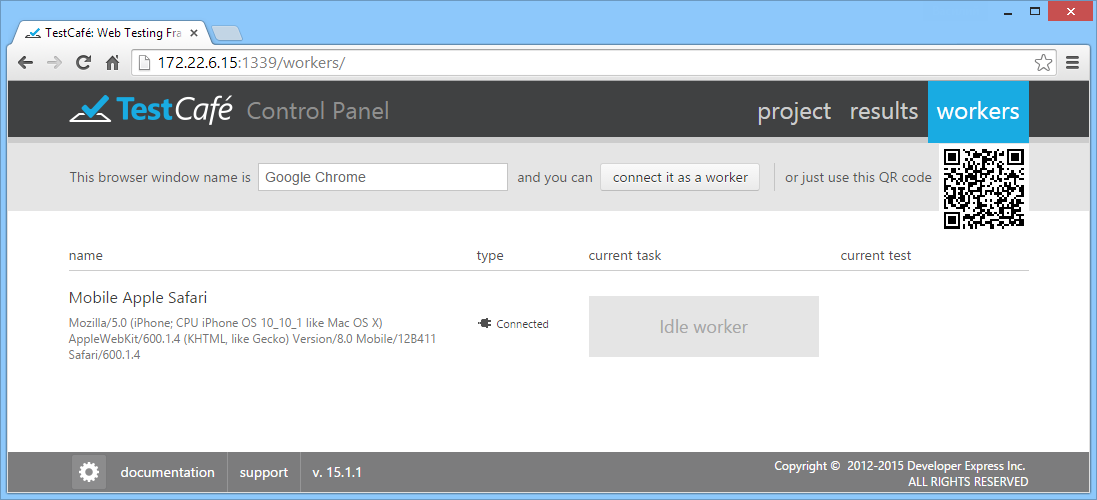
At the same time, the Workers tab on the machine running TestCafe will display a newly registered target browser.
You can switch back to the Project tab, select a fixture or an individual test and press the Run button next to it as described in the previous section. The browser chooser dialog will now display your remote worker, so you can check it together with all other browsers and click Run.
View Connected Workers
When tests are running, the Workers tab displays the test execution progress. For all workers (local and connected remotely), you will see the total number of tests, and how many have succeeded or failed so far.
All results will automatically be collected and presented in the Results tab.